Below is the Java code needed to create the Highcharts Basic Bar demo chart from their website.
This example chart is also viewable in the demo web application available on the demo page.
public class BasicBar {
public Highchart configure() {
Highchart highChart = new Highchart();
ChartOptions chartOptions = highChart.getChartOptions();
chartOptions.getChart().setType(ChartType.BAR);
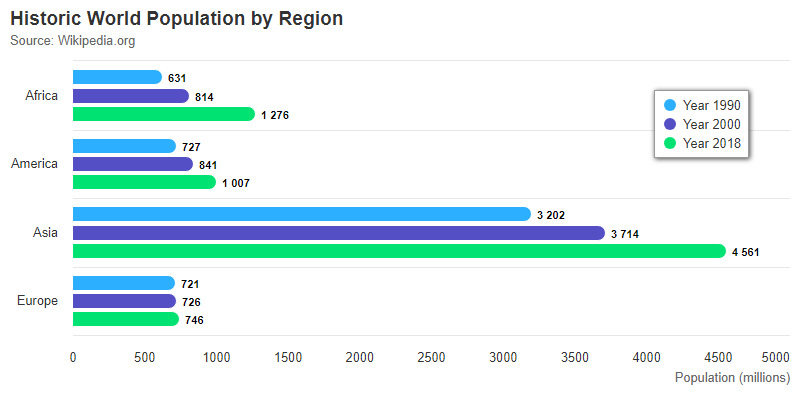
chartOptions.getTitle().setText("Historic World Population by Region").setAlign(HorizontalAlign.LEFT);
chartOptions.getSubtitle()
.setText("Source: Wikipedia.org")
.setAlign(HorizontalAlign.LEFT);
XAxis xAxis = new XAxis();
xAxis.setCategories(Arrays.asList("Africa", "America", "Asia", "Europe")).setGridLineWidth(1).setLineWidth(0);
xAxis.getTitle().setText(null);
chartOptions.getXAxis().add(xAxis);
YAxis yAxis = new YAxis();
yAxis.setMin(0).setGridLineWidth(0).getTitle().setText("Population (millions)").setAlign(TitleAlign.HIGH);
yAxis.getLabels().setOverflow(LabelsOverflow.JUSTIFY);
chartOptions.getYAxis().add(yAxis);
chartOptions.getTooltip().setValueSuffix(" millions");
chartOptions.getPlotOptions().getBar().setBorderRadius("50%").setGroupPadding(0.1).getDataLabels().setEnabled(true);
chartOptions.getCredits().setEnabled(false);
chartOptions.getLegend().setLayout(Layout.VERTICAL).setAlign(HorizontalAlign.RIGHT)
.setVerticalAlign(VerticalAlign.TOP).setX(-40).setY(80).setFloating(true)
.setBorderWidth(1).setShadow(true)
.getBackgroundColor().setColorValue("Highcharts.defaultOptions.legend.backgroundColor || '#FFFFFF'");
SeriesBar seriesBar = new SeriesBar();
seriesBar.setName("Year 1990");
seriesBar.setDataAsArrayNumber(Arrays.asList(631, 727, 3202, 721));
chartOptions.getSeries().add(seriesBar);
seriesBar = new SeriesBar();
seriesBar.setName("Year 2000");
seriesBar.setDataAsArrayNumber(Arrays.asList(814, 841, 3714, 726));
chartOptions.getSeries().add(seriesBar);
seriesBar = new SeriesBar();
seriesBar.setName("Year 2018");
seriesBar.setDataAsArrayNumber(Arrays.asList(1276, 1007, 4561, 746));
chartOptions.getSeries().add(seriesBar);
return highChart;
}
}